Ad-hoc Data Exploration on Unstructured Data in Azure

Summary
Performing exploration on unstructured data and semi structured data usually involves the preliminary step of loading the data first into a Data Warehouse, followed by using the tools the latter provides to run SQL Statements on it. This meant that data had to be redundantly maintained in two places, since there were no tools availabe to perform data exploration directly on the Data Lake Store. The advent of services like Azure Synapse Analytics, Azure Databricks - SQL Analytics (the service is in Public Preview at the time of this writing) have brought the world of Data Lake and Data Warehouse together through the support for a Lakehouse Architecture.
In this article, I will cover these topics. In addition, I will also cover how Dataflows in Power BI, and in Azure Data Factory, can be used for self service Data wrangling, by anyone with little or no expertise with SQL or other Programming Languages
Azure Databricks - SQL Analytics
SQL Analytics can be used to perform ad-hoc queries on Delta Lake tables stored in ADLS Gen2. Refer to the documentation here to understand how to enrol for the Public Preview, to provision an Endpoint in Databricks with an appropriate SKU Size. For this exploration, a X-Small Cluster SKU was used. Using the SQL Analytics end point allows even users with little knowledge of Spark to perform Data Exploration.
Assign access to the ADLS Gen2 Account
To connect to the ADLS Gen2 Account, the SQL Analytics endpoint has to be provided access, as explained here.
For more guidance on creating a Service Principal with access to the ADLS Gen 2 Account, and assigning it to the endpoint in Databricks, refer to the documentation here.
While the secret value is directly embedded in the config section below, a good practice would be to embed the secret inside a Scope in Databricks, and use the Scope name instead in the configuration here.
spark.hadoop.fs.azure.account.auth.type.<adls account name>.dfs.core.windows.net OAuth
spark.hadoop.fs.azure.account.oauth.provider.type.<adls account name>.dfs.core.windows.net org.apache.hadoop.fs.azurebfs.oauth2.ClientCredsTokenProvider
spark.hadoop.fs.azure.account.oauth2.client.id.<adls account name>.dfs.core.windows.net <Service Prinipal - Application ID>
spark.hadoop.fs.azure.account.oauth2.client.secret.<adls account name>.dfs.core.windows.net <Service Principal - Secret>
spark.hadoop.fs.azure.account.oauth2.client.endpoint.<adls account name>.dfs.core.windows.net https://login.microsoftonline.com/<AD Tenant ID>/oauth2/token
Data Exploration
SQL Analytics supports different formats for the raw, unstructured data in the underlying Data Lake, like Parquet, ORC, CSV, Delta, etc.
1) Create Table in Databricks SQL Analytics pointing to the Data Source in ADLS
Creating a Table creates a reference in Databricks SQL Analytics to the underlying unstructured Data source in ADLS Gen2, along with the Schema of the data. SQL Queries issued on this Table are executed directly on the data in the Data Source. Refer to ‘CREATE TABLE USING’ - OPTION for the syntax and options to create the Table
Optionally, specifying the option ‘WITH SELECT’ when creating the table, populates the data from the underlying Data Source.
The SQL Statement below creates an ‘employee’ Table in Databricks SQL Analytics based on a CSV file in ADLS Gen2
2) Explore Data using SQL Statements
Now, we can explore data in this Table using the rich SQL Syntax that Databricks SQL Analytics supports. Refer to the SQL Reference Guide. A simple example shown below:
SELECT Count(*), Variable_category, SUM(Value) FROM default.census GROUP BY Variable_Category
The screen shot below shows sample SQL Commands executed on the Delta Table
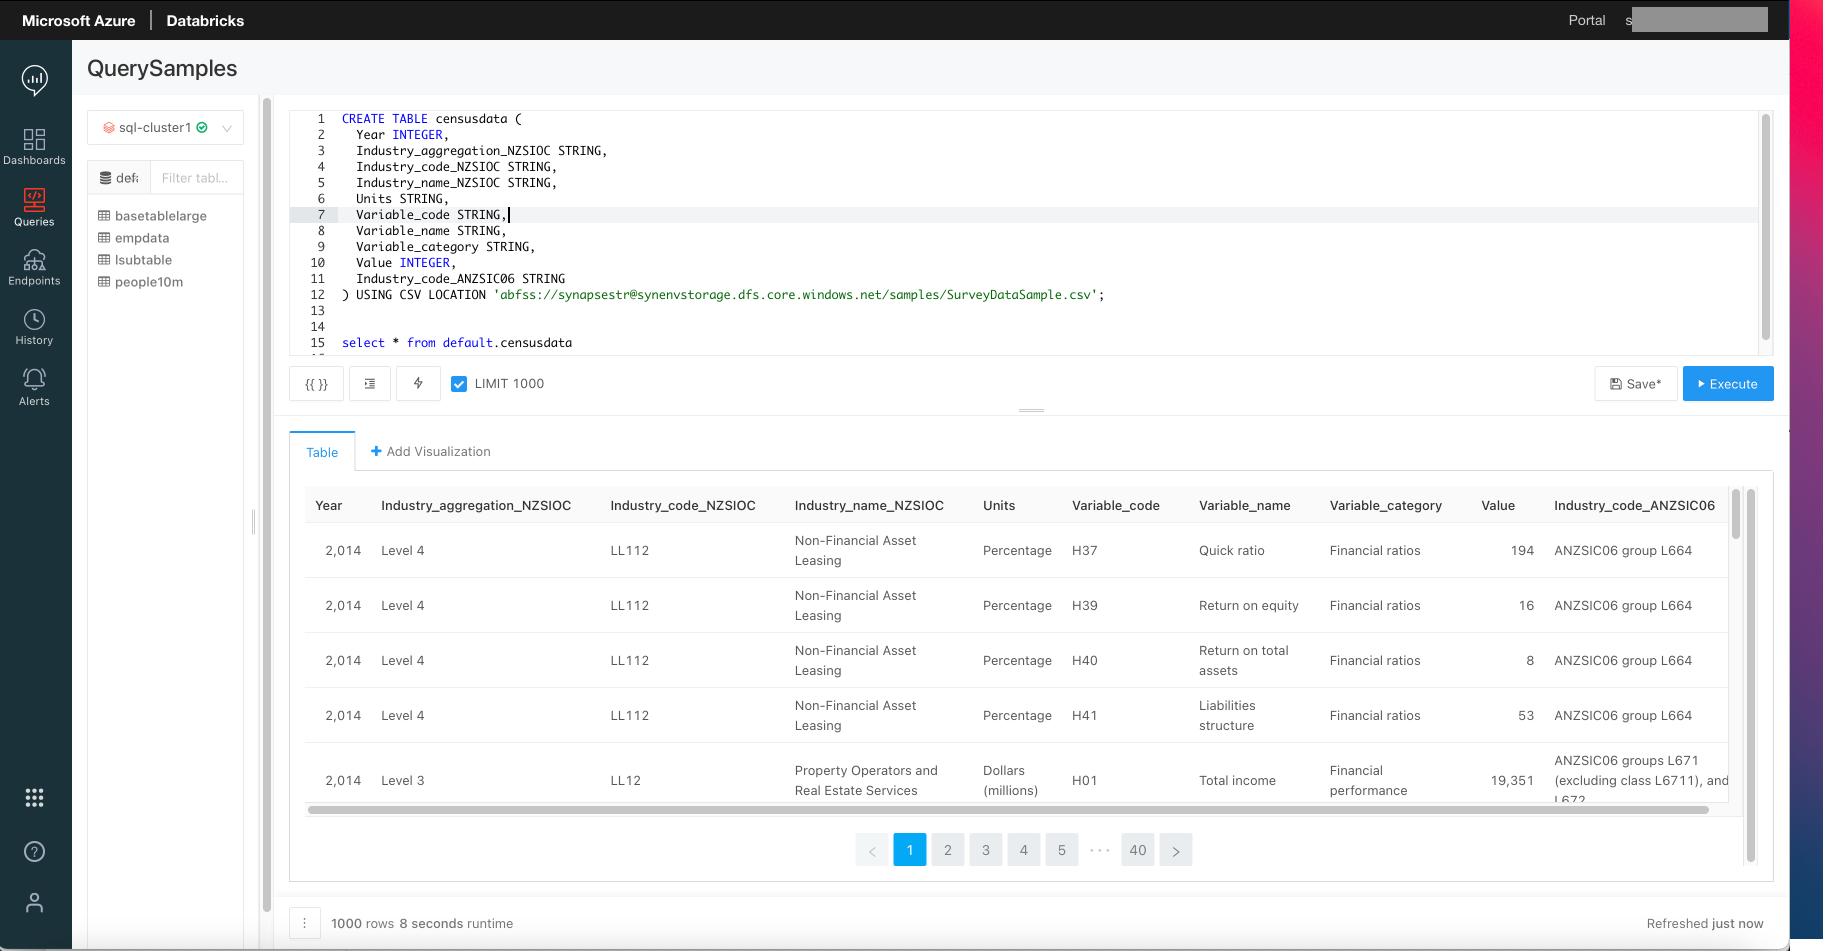
Figure 1 - Query CSV File in Data Lake Directly
3) Additional features with Delta Table as the underlying Data Source
3a) Table creation is optional
When the underlying Data Source is a Delta Table, then creation of a Table in Databricks SQL Analytics is optional. Queries can be directly issued on the Delta Table specifying its location. If a Table is created, then operations on it execute on the Delta Table in ADLS Gen2.
The screen shot below shows how to create a Table in Databricks SQL Analytics that points to the Delta Table in ADLS Gen2, and executing queries on this table.
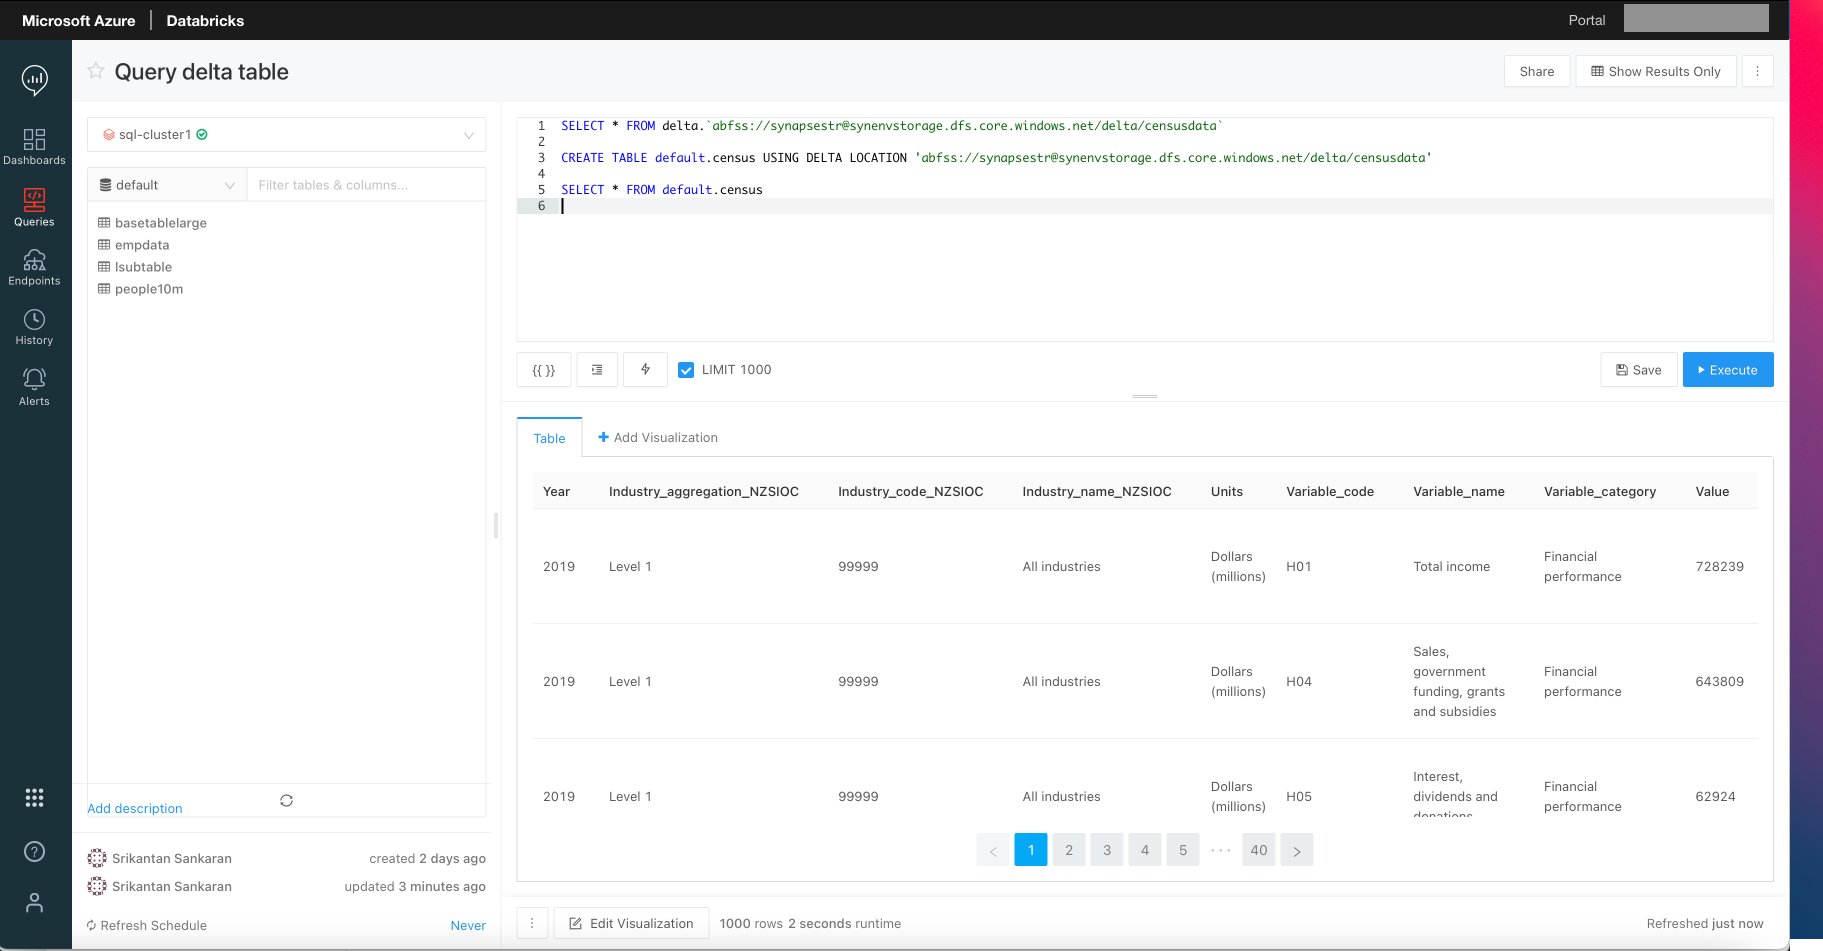
Figure 2 - Query Delta Lake Directly
3b) Delta Table - DML Statements support
All data operations like Inserts, Upserts, performing Time travel, etc on the delta Table can be performed directly from the Query Editor of Databricks SQL Analytics.
DML Statements on the Table in Databricks SQL Analytics would execute on the underlying Delta Table in ADLS Gen2.
DML Statements cannot be executed when the underlying data source is other than Delta Table
When specifying a Table pointing to the underlying Delta Table in ADLS Gen2, Databricks SQL Analytics acts as a serving layer for Power BI Reports. Refer to documentation for the steps to use the Databricks Connector in Power BI to connect to the Table in SQL Analytics.
Refer to the Databricks SQL Analytics documentation to explore the other features that it provides.
Azure Synapse Analytics
Azure Synapse brings in both SQL Technologies for Data Warehousing & Business Intelligence and Spark for processing of Big Data Workloads under one roof. Both these technologies can be used to perform exploration on unstructured Data. One of the offerings under SQL technologies is the on-demand, Serverless Pool, which is covered in this article. As of this writing, ad-hoc exploration of Data Sources like Delta Tables requires a dedicated Spark Pool, which is also covered here.
Exploration using an On-Demand Serverless Pool
Like with Databricks SQL Analytics, this tool can be used by Users with no knowledge of Spark. Users can use just SQL to interact with and explore the data. In addition, there are no compute resources to be provisioned, sized, or managed to perform the data exploration tasks.
Synapse Analytics requires a ‘Primary’ Azure Data Lake Store Gen2 (ADLS) Account to be associated. Additional ADLS Accounts can also be associated as ‘Linked Services’. The data for exploration can exist in either of these Accounts. Linked Services can also include Azure Blob Storage Accounts that host the unstructured data for exploration.
1) Working with different Data Source formats
Synapse Analytics can connect to Data Source formats like CSV, Parquet, Json, etc
1a) Query CSV Files in ADLS Gen 2
For CSV Files, the Schema has to be specified in the Query
The screenshot below shows the response to the query
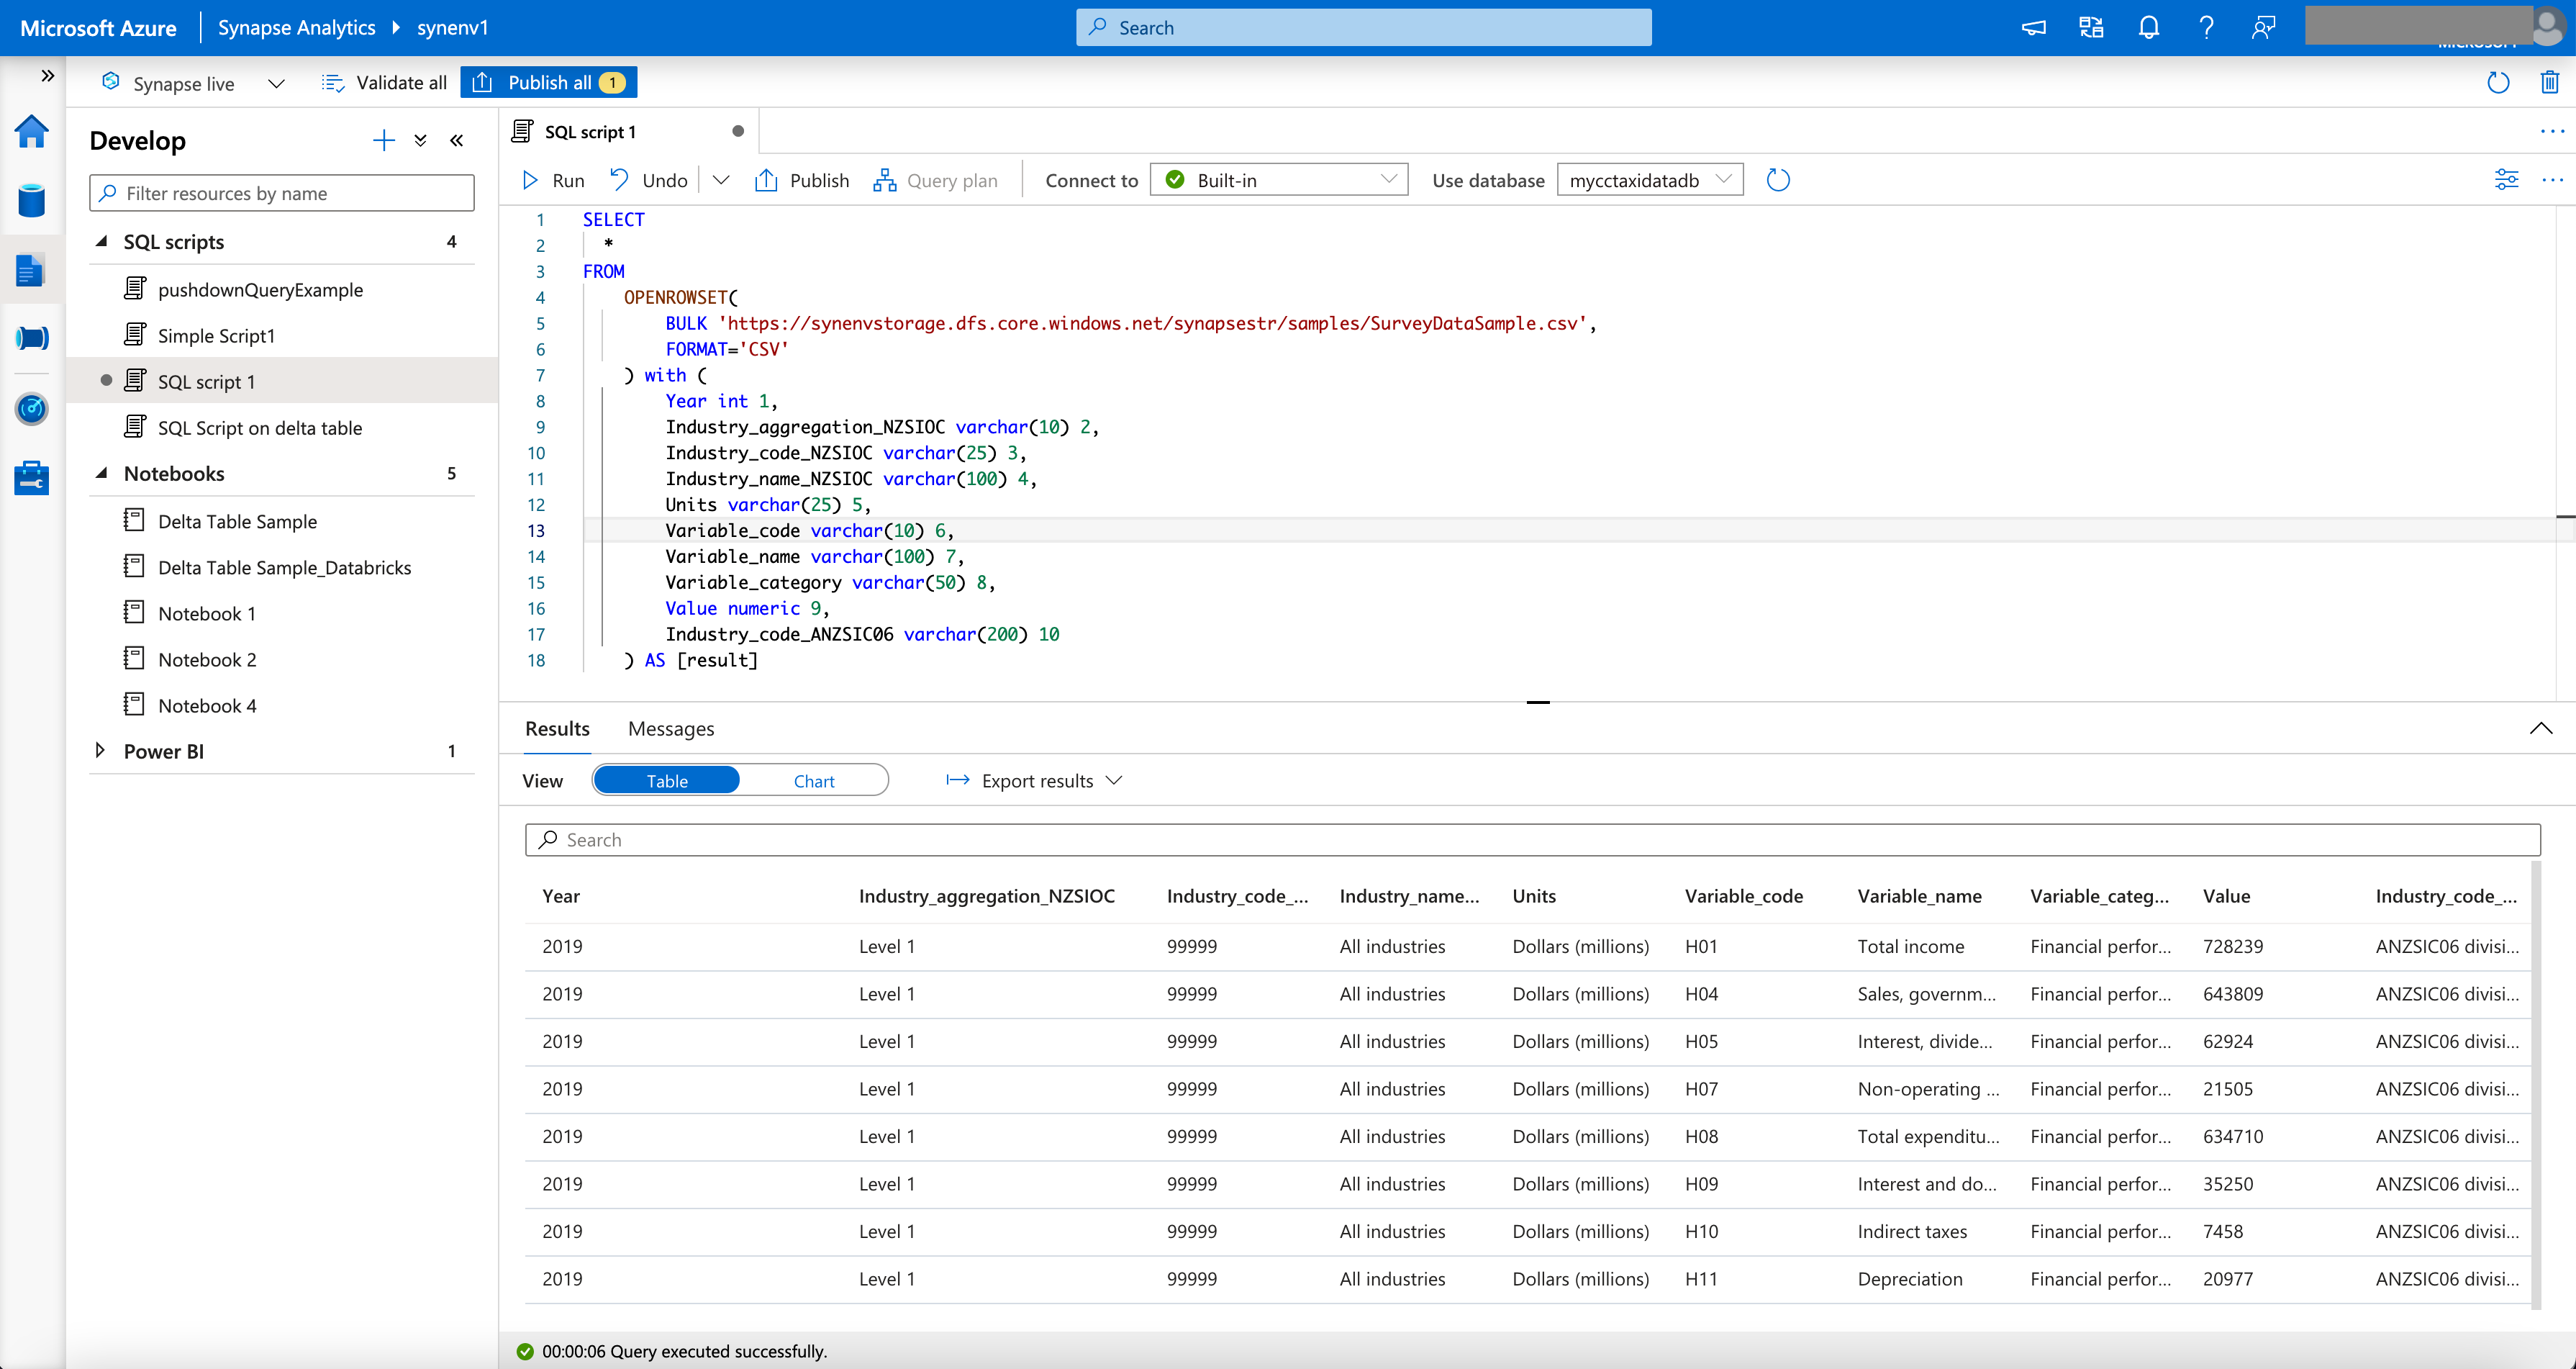
Figure 3 - Query CSV File in ADLS Gen2 Directly
1b) Query Parquet Files in ADLS Gen 2
The example below shows how predicate push down is used to query parquet data that is partitioned. The column ‘Variable_category’ used to partition the data in the Parquet file, is used as a filter in the query. File metadata is used in the example below. Presently, ‘filepath’ and ‘filename’ are the two metadata options available in Synapse. Refer to this link for more information
The screenshot below shows the response to the query
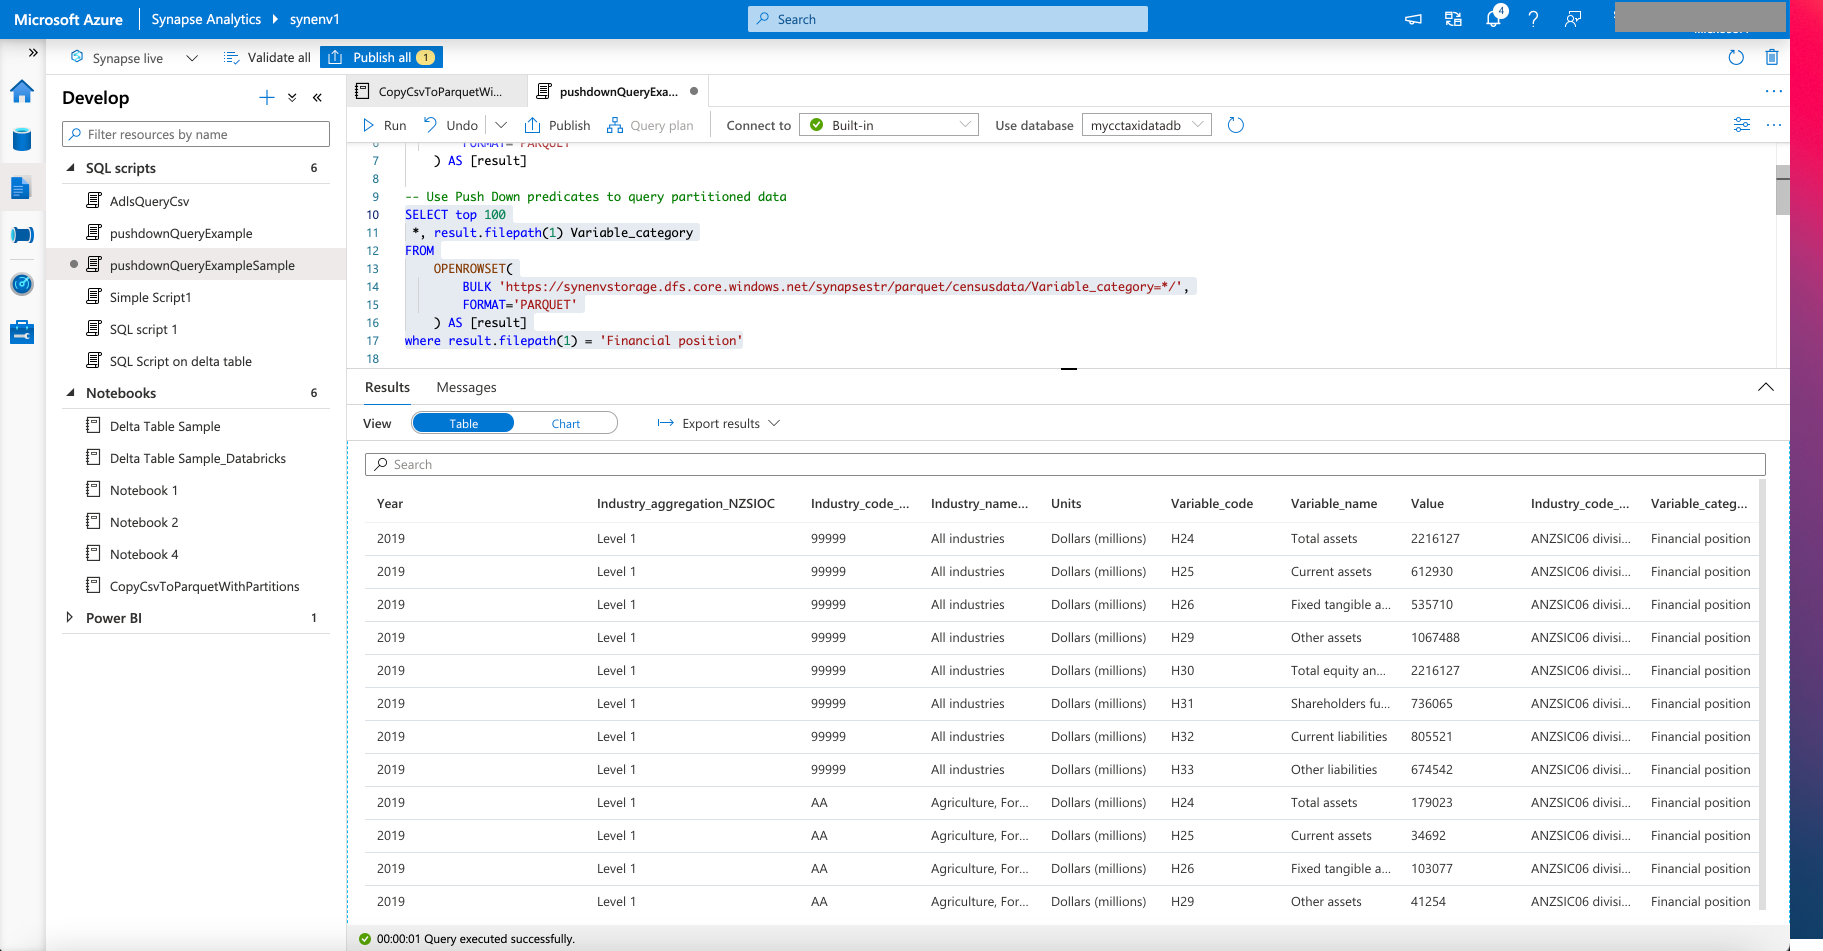
Figure 4 - Query partitioned parquet Files in ADLS Gen2
--Execute count queries on the data based on partitions
SELECT count(*) as numRecords
FROM
    OPENROWSET(
        BULK 'https://synenvstorage.dfs.core.windows.net/synapsestr/parquet/censusdata/Variable_category=*/',
        FORMAT='PARQUET'
    ) AS [result]
where result.filepath(1) = 'Financial position'
1c) Create Views to store the Query results
Database views can be created directly on the Parquet Data. Queries run on the Views would be executed on the Parquet data in ADLS Gen2. The snippet below creates a Database View based on the entire Parquet data. It includes the values for the Partitions as columns in the View that can be queried upon
CREATE VIEW dbo.censusdata as
SELECT
   *, result.filepath(1) Variable_category
FROM
    OPENROWSET(
        BULK 'https://synenvstorage.dfs.core.windows.net/synapsestr/parquet/censusdata/Variable_category=*/',
        FORMAT='PARQUET'
    ) AS [result]
The snippet below shows how easy it is to query the Database View. When executed, both these queries would return the same results.
select count(*) from dbo.censusdata WHERE Variable_category = 'Financial position'
SELECT count(*) as numRecords
FROM
    OPENROWSET(
        BULK 'https://synenvstorage.dfs.core.windows.net/synapsestr/parquet/censusdata/Variable_category=*/',
        FORMAT='PARQUET'
    ) AS [result]
where result.filepath(1) = 'Financial position'
When specifying a View or a Table pointing to the underlying Parquet files in ADLS Gen2, Azure Synpase Analytics Serverless Pool acts as a serving layer for Power BI Reports. Refer to documentation for the steps.
1d) Query Delta Files in ADLS Gen 2
I have used the dedicated Spark Pool available in Synapse Analytics to demonstrate the querying of data from Delta Tables.
The following creates a Delta Table from a CSV File, and then queries the Delta Table
%%pyspark

df = spark.read.load('abfss://synapsestr@synenvstorage.dfs.core.windows.net/samples/SurveyDataSample_headers.csv', format='csv', header='true');
df.show();

df.write.format("delta").save("/delta/censusdata");
See below for the output from the Spark Job
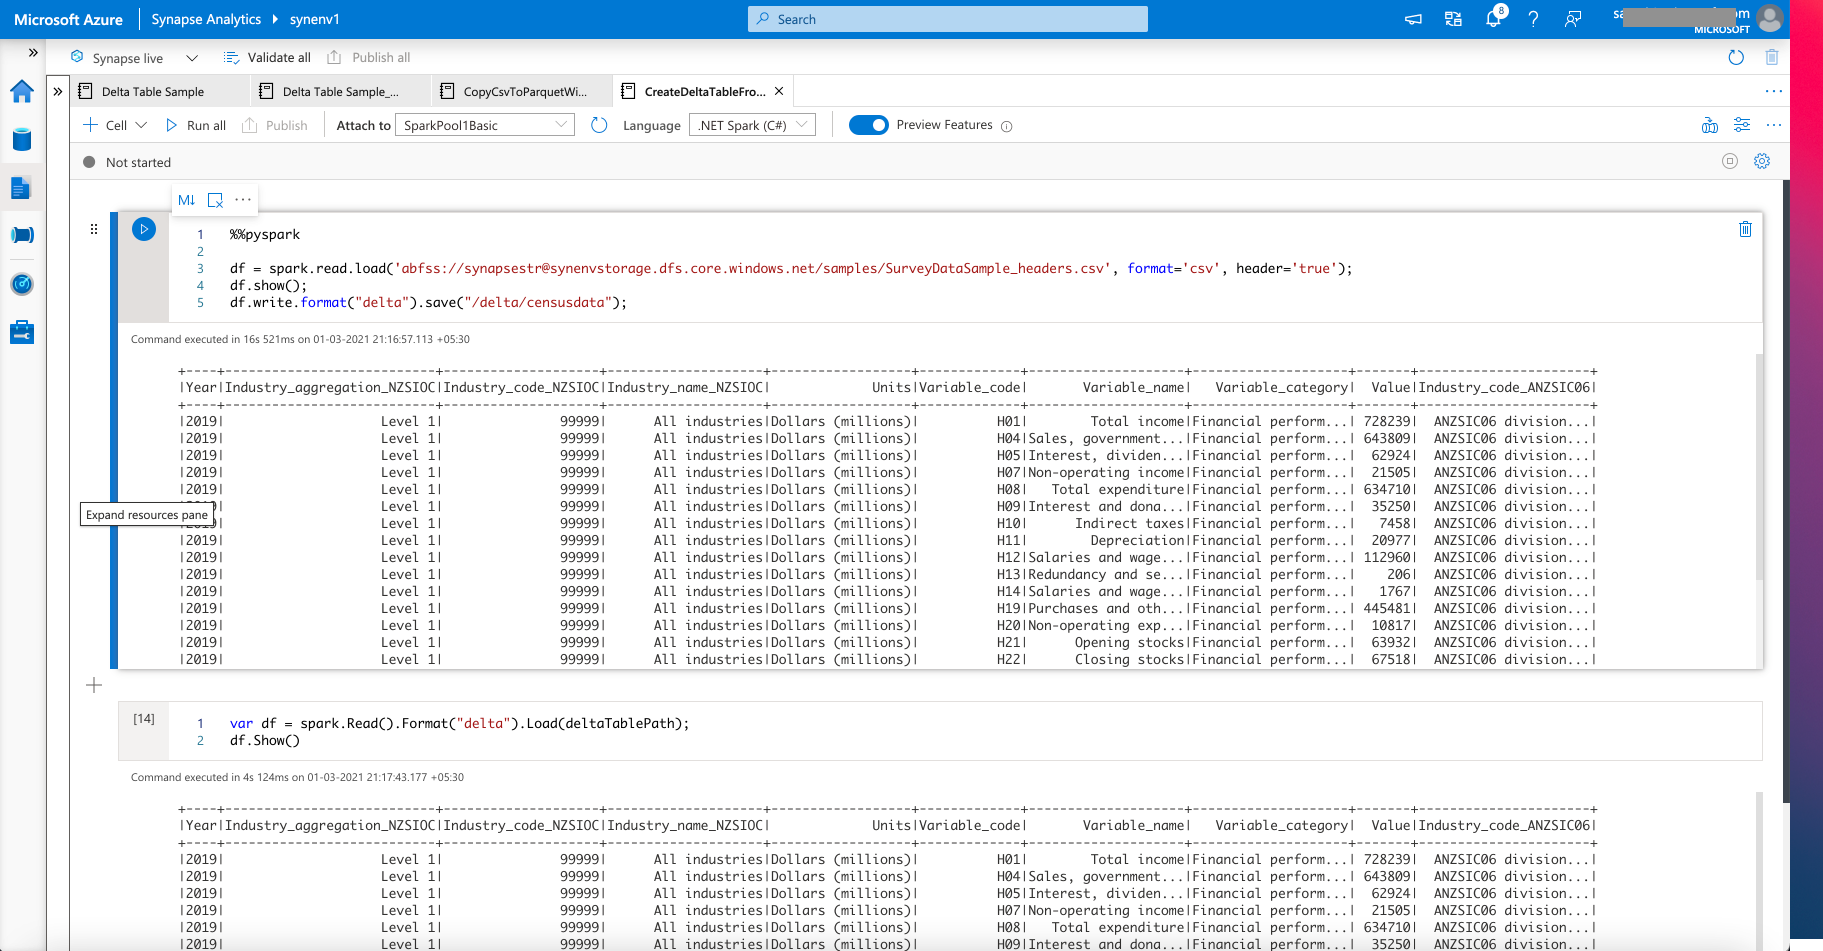
Figure 5 - Creating a Delta Table from a CSV File in ADLS Gen2
Power BI Dataflows
Power BI Dataflows provide options for Self-service Data wrangling, which involves connecting to different data sources, perform exploration on the data before transforming them for consumption in Power BI Reports and Dashboards. For data exploration, the Power BI Designer (Web based & Power BI Desktop) provides Power Query features that lets user query and transform the data.
In this example, I have used the sample census dataset used earlier in the article, and split that into multiple CSV Files in a different ADLS Gen2 folder.
Authoring a new Dataflow
The steps described here were performed, to connect to the ADLS Gen2 account that contains the multiple CSV Files to be used for exploration.
The Mashup Editor/Wizard in Power BI Designer shows the different files detected in ADLS Gen2 location, and provides an option to combine all the files
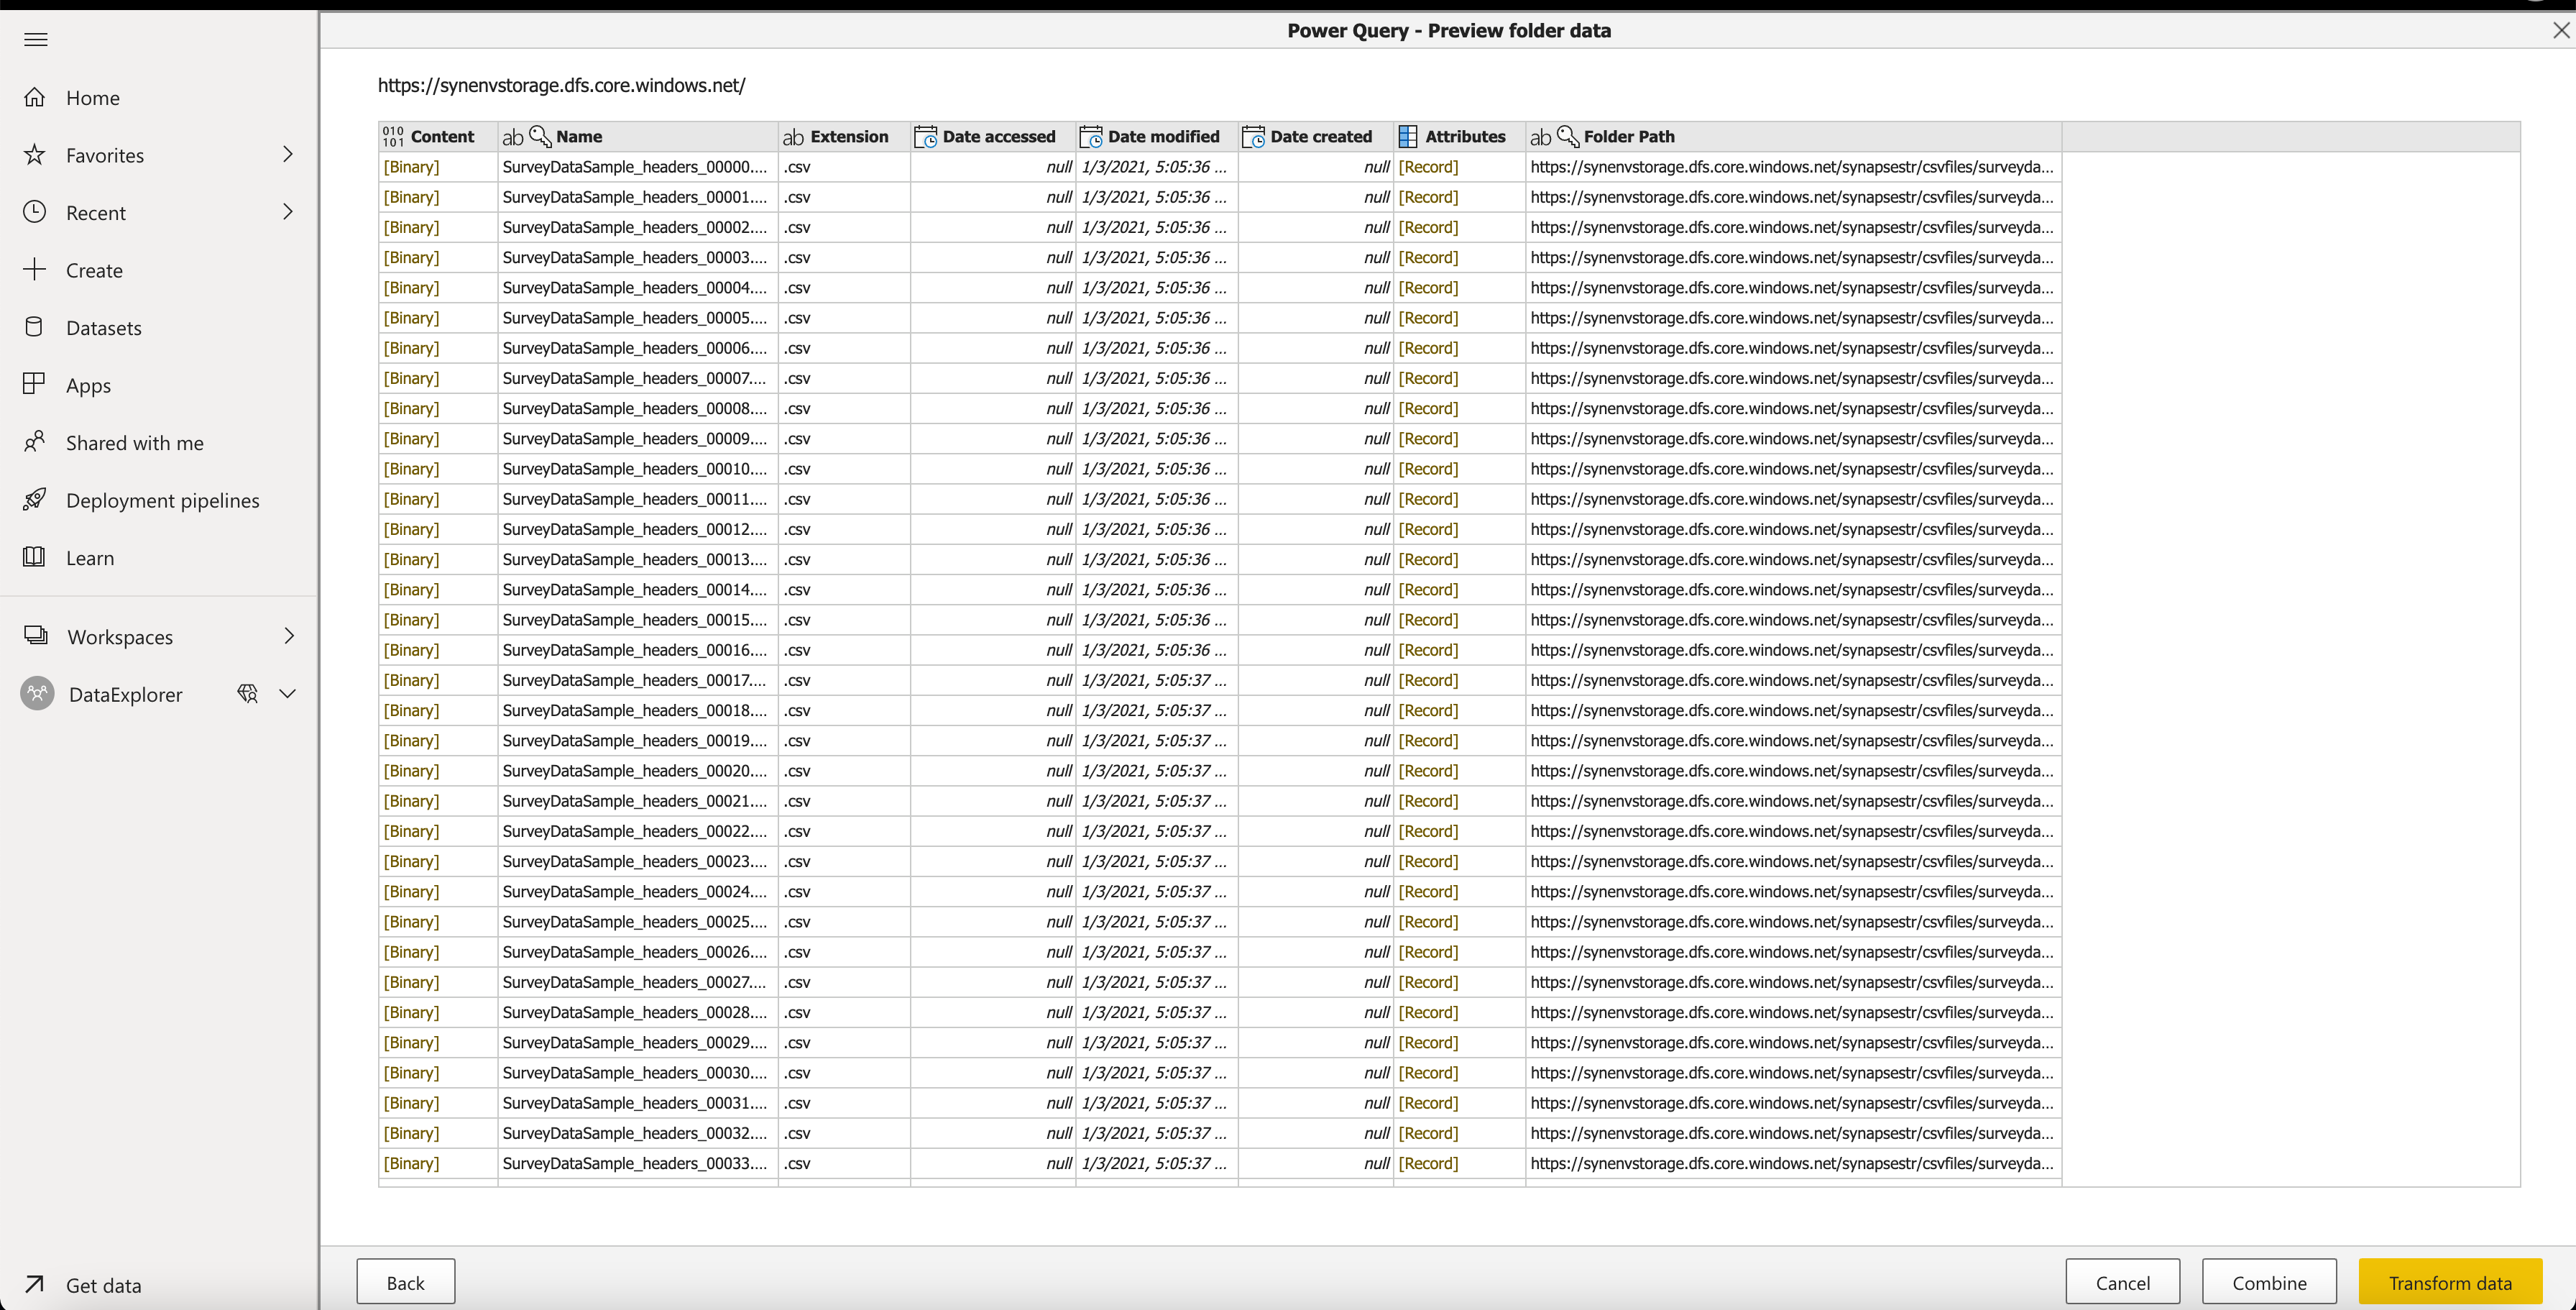
Figure 6 - Power BI Designer - Wizard - step 1
The next step in the Wizard displays the contents of the different CSV Files after they were combined in the previous step. See below:
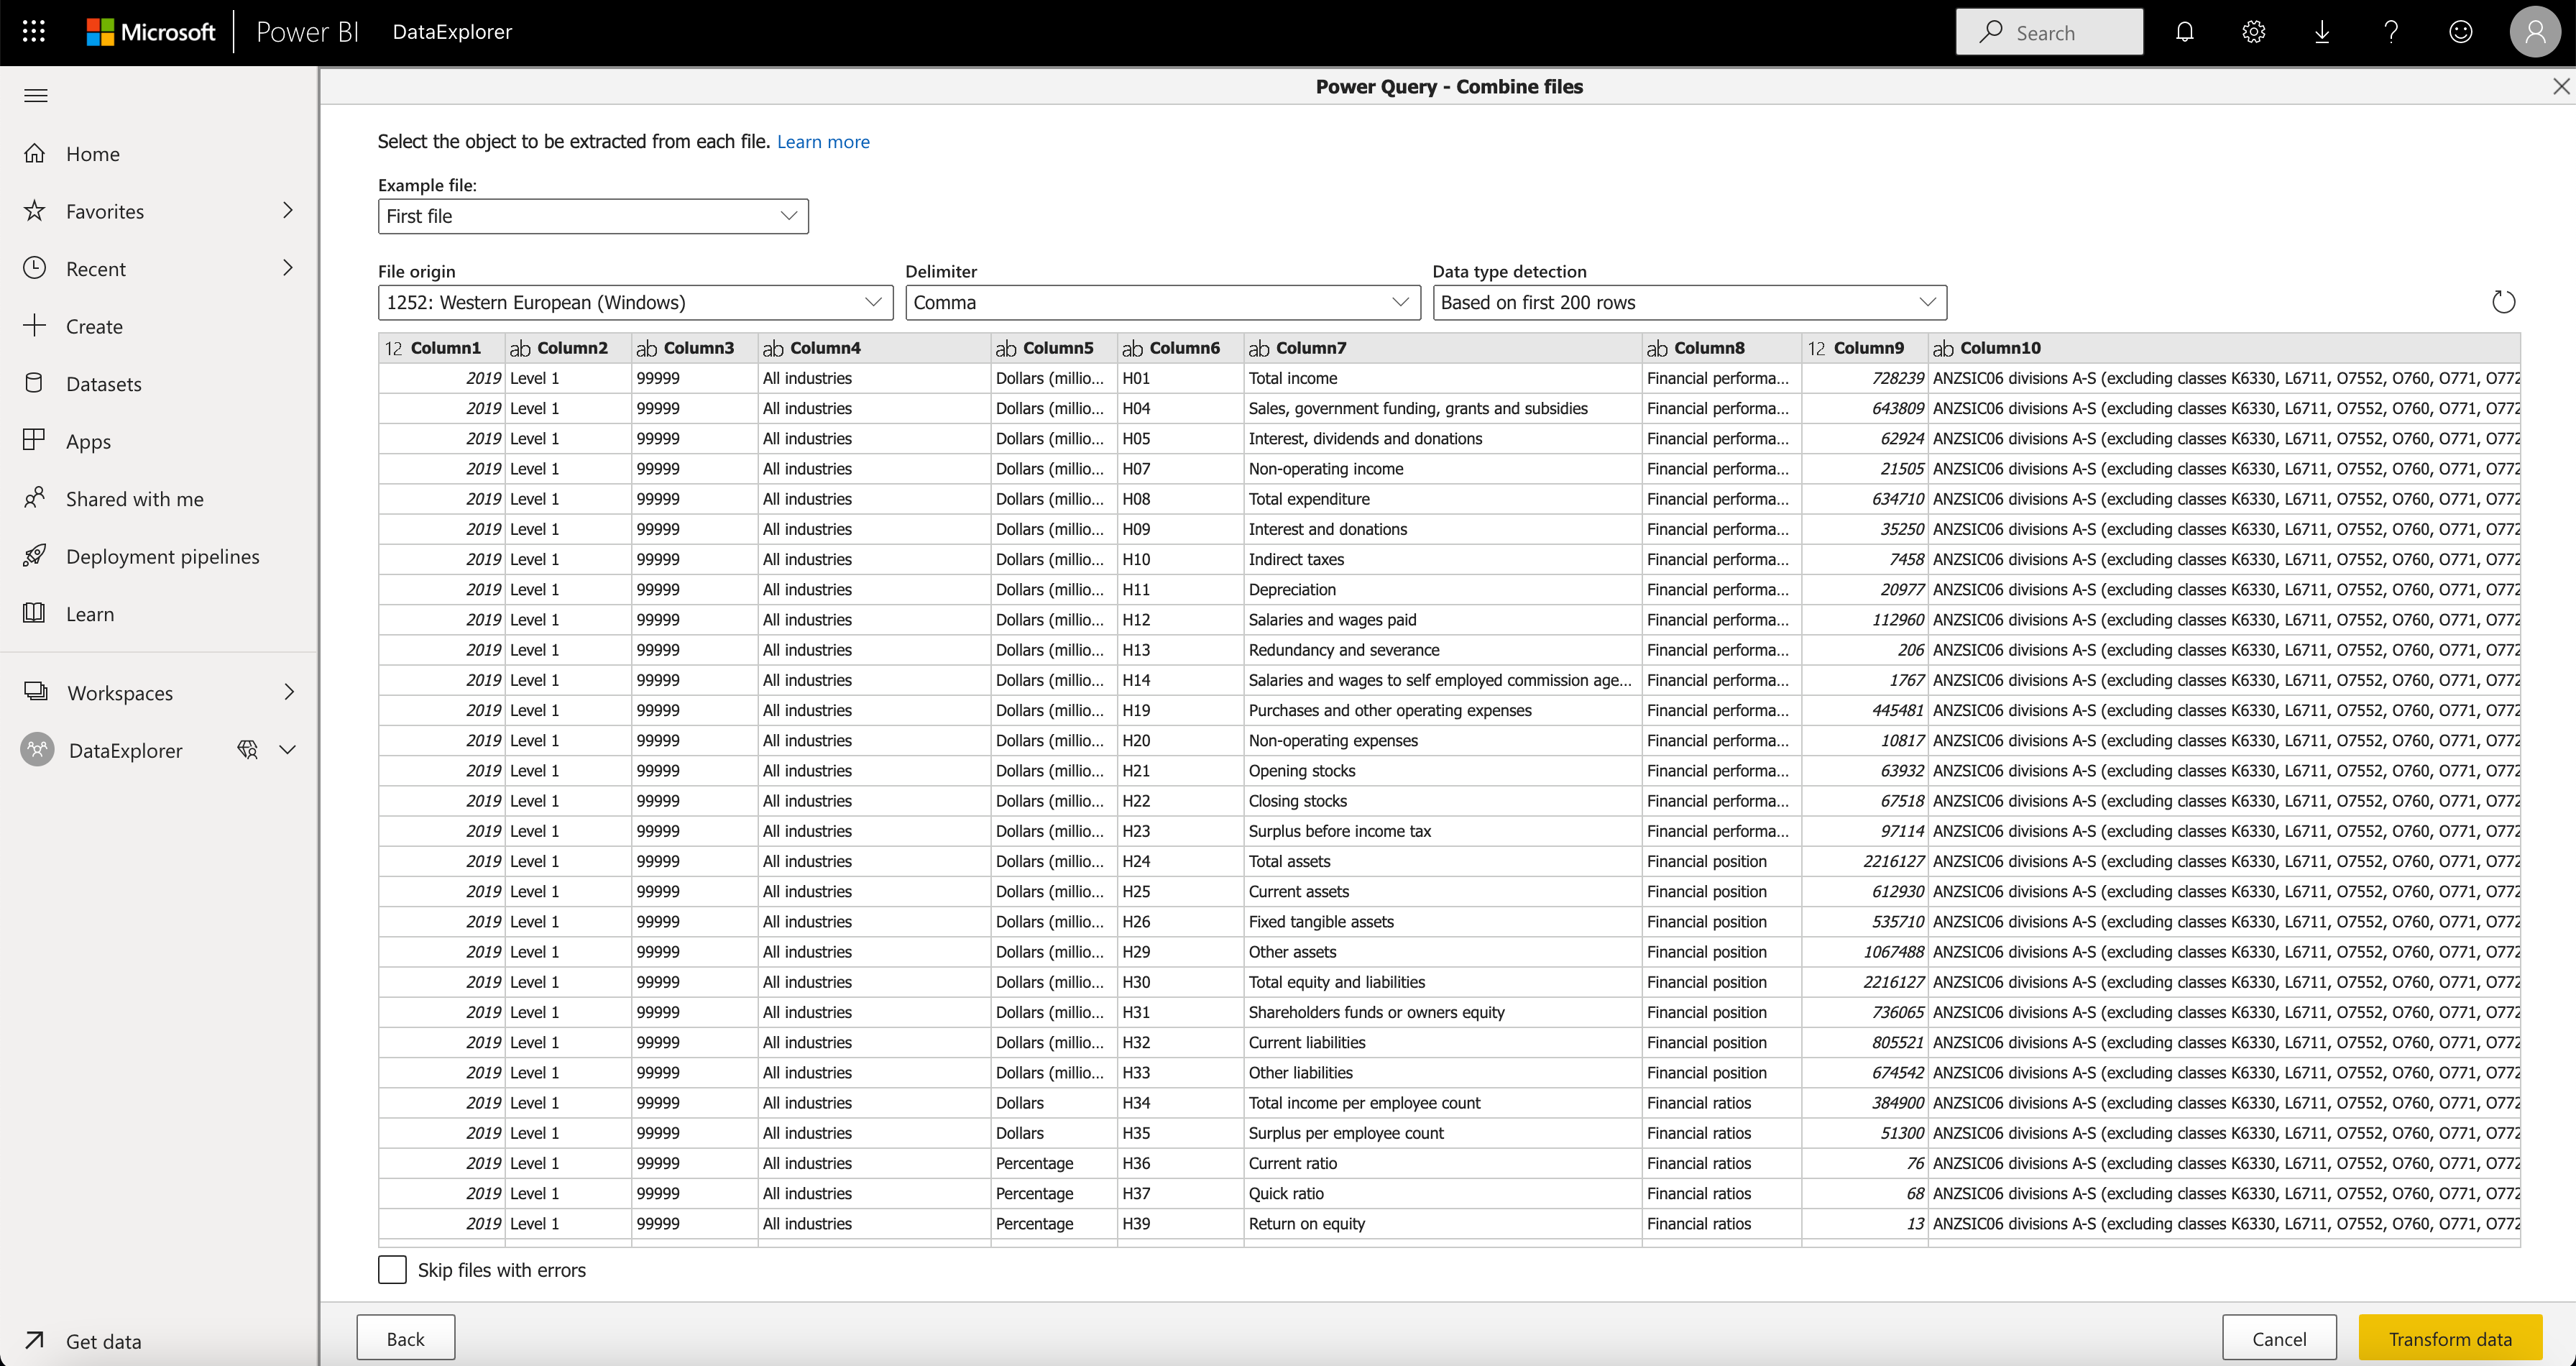
Figure 7 - Power BI Designer - Wizard - step 2
Use the options in the Power Query wizard to Sort, filter data, perform count of rows, change data types, perform aggregations. These steps can be performed by a user without any knowledge of SQL or Spark. While the menu options in the wizard provides the most commonly used features for data exploration and transformation, additional calculations and advanced computations can be performed by writing Code using the ‘M’ Language.
Refer to this link to understand about Power Query and to this on the options for Data transformation it provides.
The other advantages of this approach are that it does not require the provisioning of any Azure Services, can be performed right within the Power BI Designer. Using the Designer requires the user to have a Power BI Pro License. A default capacity of computational resources, storage are allocated to the ‘Shared capacity’ associated to the Pro License by default. When dealing with larger datasets and for a better user experience, the Pro License can be associated to higher compute and memory resources through Power BI Premium.
This approach can be used for data sources with CSV, Json file types, but cannot be used for Parquet or Delta Tables at the time of this writing. While individual Parquet files can be used for exploration, it is not possible to combine multiple Parquet files inside a folder.
Wrangling Dataflows in Azure Data Factory
This option is based on the same Power Query Engine used in Power BI Dataflows, and available as a part of the Azure Data Factory UI. Since the steps to perform are similar, these are not described here in detail. Refer to the documentation link here for more details. With this approach, performing exploration on the data using the Power Query Engine itself does not require any compute resources to be provisioned, other than creating a Data Factory Resource in Azure.
Azure Data Explorer
The approach with Data Explorer involves creating an external Table that points to the Data sources in ADLS Gen 2 or Azure blob Storage Accounts. The data itself is not ingested into Data Explorer. Kusto Query Language (KQL) is used to write the queries to explore the data. Refer to the documentation here for more details.
Using Data Explorer involves the provisioning of Compute resources to perform this exploration.